As of September 23, 2026, ChicagoApartmentBuildings.com tracks 290 apartment buildings in 12 Chicago neighborhoods, with 79,170 apartment units between them. This post gathers the directory’s Chicago apartment building statistics in one place: how many buildings are in each neighborhood, how old and how tall they are, which amenities their listings record, and how close they are to a CTA station.
Every number below was computed from the directory’s own listing data on the date above. None is estimated. The figures describe the 290 buildings in this directory, not every apartment building in Chicago. Neighborhoods are listed alphabetically; the directory does not rank buildings or neighborhoods, and it does not publish rents or availability.
Chicago apartment building statistics at a glance
These Chicago apartment building statistics describe the 290 apartment buildings this directory published on September 23, 2026. They are not a survey of every apartment building in Chicago. The apartment building statistics below are recomputed as listings are corrected, so a figure here is accurate to its date rather than to today, and the apartment building statistics on the directory’s data page are the ones kept current.
- Apartment buildings tracked: 290
- Apartment units in those buildings: 79,170
- Neighborhood categories: 12
- Median year built: 2014
- Median height: 19 floors
- Median distance to the nearest CTA rail station: 0.2 miles
- Amenities recorded for every building: 5 — pet-friendly, gym or fitness center, air conditioning, in-building parking, in-unit laundry
Every figure in these apartment building statistics was computed from the directory’s own listing data rather than estimated. A blank field is treated as unknown and left out of a median, never counted as zero, so these apartment building statistics never turn a missing value into a zero.
How many apartment buildings does ChicagoApartmentBuildings.com track?
ChicagoApartmentBuildings.com tracks 290 Chicago apartment buildings with a combined 79,170 apartment units. The median building in the directory has 230 units and 19 floors.
Unit counts are recorded for all 290 buildings. Floor counts are recorded as a single number for 289 of 290; one listing covers two towers of different heights and is left out of the floor figures.
How many apartment buildings are in each Chicago neighborhood?
The 290 buildings fall into 12 neighborhood categories. These apartment building statistics divide them in alphabetical order. In alphabetical order:
- Gold Coast / Old Town: 34 buildings with 7,765 apartment units.
- Lakeview: 24 buildings with 2,878 apartment units.
- Lincoln Park: 22 buildings with 3,501 apartment units.
- Near North Side: 7 buildings with 1,941 apartment units.
- Near West Side: 9 buildings with 2,058 apartment units.
- River North: 43 buildings with 14,169 apartment units.
- South Loop: 43 buildings with 14,793 apartment units.
- Streeterville / Lakeshore East: 22 buildings with 10,493 apartment units.
- The Loop: 13 buildings with 4,287 apartment units.
- Uptown / Edgewater: 22 buildings with 3,633 apartment units.
- West Loop / Fulton Market: 42 buildings with 12,793 apartment units.
- Wicker Park / Bucktown / Logan Square: 9 buildings with 859 apartment units.
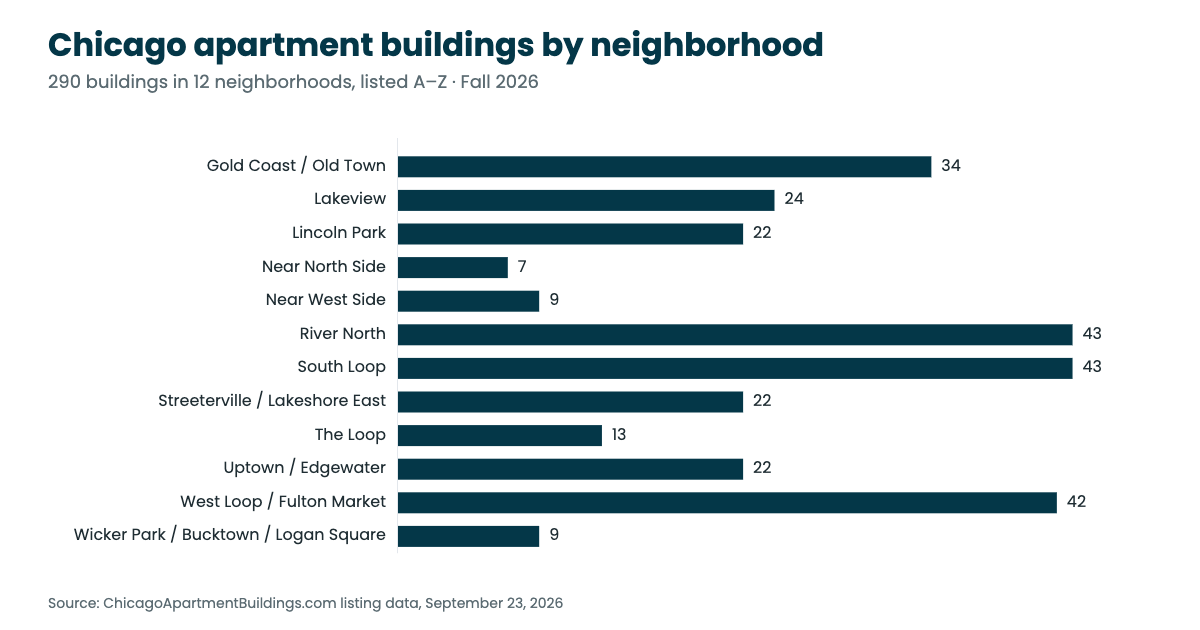
Each neighborhood name links to its page in the directory, which lists every building in that neighborhood with its address, year built, floors and unit count.
How old are Chicago apartment buildings?
The median year built across the directory is 2014, based on the 289 buildings with a recorded year. The mean year built is 1997, which makes the average building in the directory about 29 years old in 2026. The oldest recorded year built is 1892 and the newest is 2026. The apartment building statistics for building age cover the 289 buildings with a recorded year.
174 of the 289 buildings (60.2%) were built in 2010 or later, and 35 (12.1%) were built before 1940. One building, 400 Lake Shore Drive, has no recorded year built and is left out of these figures.
| Year built | Buildings | Share |
|---|---|---|
| before 1940 | 35 | 12.1% |
| 1940–1979 | 31 | 10.7% |
| 1980–1999 | 29 | 10.0% |
| 2000–2009 | 20 | 6.9% |
| 2010–2019 | 114 | 39.4% |
| 2020 or later | 60 | 20.8% |
What percentage of Chicago apartment buildings are pet friendly?
280 of the 290 apartment buildings in the directory (96.6%) are recorded as pet-friendly. The full list is on the pet-friendly Chicago apartment buildings page.
Pet policies, including fees, deposits and breed or weight limits, differ from building to building and can change. Confirm the current policy directly with a building before applying.
Which amenities do Chicago apartment buildings have?
The directory records five amenities for every building. These apartment building statistics count a building once for each amenity its listing records. Across all 290 buildings:
| Amenity | Buildings | Share |
|---|---|---|
| Pet-friendly | 280 | 96.6% |
| Gym or fitness center | 261 | 90.0% |
| Air conditioning | 215 | 74.1% |
| In-building parking | 214 | 73.8% |
| In-unit laundry | 204 | 70.3% |
Pet-friendly: 280 of 290 buildings (96.6%). Gym or fitness center: 261 of 290 buildings (90.0%). Air conditioning: 215 of 290 buildings (74.1%). In-building parking: 214 of 290 buildings (73.8%). In-unit laundry: 204 of 290 buildings (70.3%).
These amenities are recorded as yes-or-no fields. A building counts only where its listing records the amenity, so each share is a minimum rather than the result of a survey. Read the apartment building statistics for each amenity as a floor, not a ceiling.
The five shares above are a snapshot taken on September 23, 2026. The directory recomputes them whenever a building’s listing is corrected, so the current shares can differ from the apartment building statistics on this page. The apartment building statistics the directory keeps current are published on the Chicago Apartment Building Data page, and every change to the underlying data is logged on the Data Updates page.
How close are Chicago apartment buildings to the CTA?
289 of the 290 buildings have a nearest CTA rail station and a distance to it recorded. The median distance is 0.2 miles. 252 of those 289 buildings (87.2%) are within half a mile of a CTA station, and 10 are less than 0.1 miles from one.
Each building’s page names its nearest station, the lines that serve it and the recorded distance. Current routes, maps and service alerts for every station are published by the Chicago Transit Authority.
Chicago apartment building statistics by neighborhood
The table below gives the main figures for each neighborhood, in alphabetical order. Medians describe the middle building in each neighborhood. The apartment building statistics in this table use the same September 23, 2026 export as the sections above.
| Neighborhood | Buildings | Units | Median year built | Median floors | Median distance to CTA |
|---|---|---|---|---|---|
| Gold Coast / Old Town | 34 | 7,765 | 1985 | 18 | 0.2 mi |
| Lakeview | 24 | 2,878 | 1969 | 6 | 0.5 mi |
| Lincoln Park | 22 | 3,501 | 2000 | 11 | 0.5 mi |
| Near North Side | 7 | 1,941 | 2018 | 21 | 0.1 mi |
| Near West Side | 9 | 2,058 | 2018 | 15 | 0.1 mi |
| River North | 43 | 14,169 | 2013 | 30 | 0.2 mi |
| South Loop | 43 | 14,793 | 2016 | 23 | 0.2 mi |
| Streeterville / Lakeshore East | 22 | 10,493 | 2009 | 47 | 0.5 mi |
| The Loop | 13 | 4,287 | 2016 | 33 | 0.1 mi |
| Uptown / Edgewater | 22 | 3,633 | 1995 | 9 | 0.2 mi |
| West Loop / Fulton Market | 42 | 12,793 | 2018 | 19 | 0.2 mi |
| Wicker Park / Bucktown / Logan Square | 9 | 859 | 2017 | 6 | 0.1 mi |
| All 12 neighborhoods | 290 | 79,170 | 2014 | 19 | 0.2 mi |
Coverage: South Loop’s median CTA distance is based on 42 of its 43 buildings, Streeterville / Lakeshore East’s median year built on 21 of 22, and Wicker Park / Bucktown / Logan Square’s median floors on 8 of 9. Every other figure in the table covers every building in its neighborhood.
Where do these numbers come from?
Every figure in this post was computed on September 23, 2026 from the 290 published listings in ChicagoApartmentBuildings.com. Where a median falls between two values, the two are averaged and rounded: to a whole number for years, floors and units, and to one decimal place for miles. A blank field is treated as unknown and left out, never counted as zero. Nothing in these apartment building statistics is estimated or carried over from another source.
The full dataset, with per-neighborhood amenity tables, is on the Chicago Apartment Building Data page. Changes to the underlying data are logged on the Data Updates page. To browse every building by name, use the Chicago Apartment Buildings A–Z index.
How to use these apartment building statistics
These apartment building statistics are a starting point for narrowing a search, not a replacement for a building’s own listing. Where a share matters to the apartment you want — in-unit laundry, say, or in-building parking — the apartment building statistics tell you how common it is, and the directory tells you which buildings record it: open a neighborhood page or the Chicago Apartment Buildings A–Z index and check the field on each building’s page.
What the apartment building statistics on this page do not include is rent or availability. The directory publishes neither, so no figure here reflects price, and a recorded amenity says only that the listing records it, never what it costs.
For help applying these apartment building statistics to a specific search, ChicagoApartmentBuildings.com is run by Joe Bjorklund, a licensed Illinois real estate broker, brokered by Baird & Warner, who works as a Chicago apartment locator. A locator’s fee is most often paid by the landlord or leasing office once you sign a lease, rather than by the renter.
New to Chicago this fall? The Away-Team Bars in Chicago guide lists where out-of-town NFL and college football fans watch games, with the apartment neighborhoods nearby.